Technical Indicators:
Support Level: $7950, $7500, $6800
Resistance Level: $8000-8050, $8150, $8300
Key Points:
- Bitcoin price surged massively and broke above $8000 resistance level in order to record around 13% gain in the last 24 hours.
- A new yearly high for BTC price was recorded around $8180.
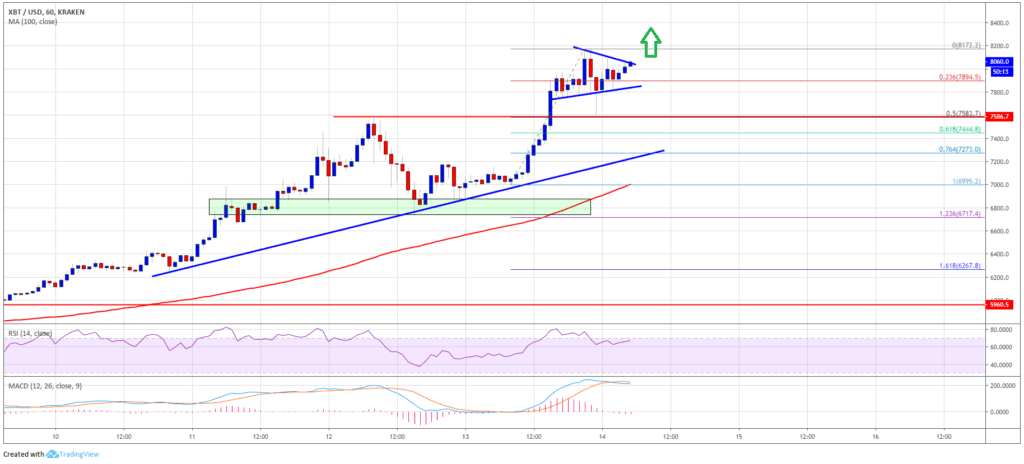
- A bearish pattern line is currently being formed on the hourly chart with the resistance between $8000 and $8050 which might push the price downwards.
- If Bitcoin price breaks above $8100 level in the short term, it might soon test $8500 level.
Bitcoin Price Analysis:
SUMMARY: Bitcoin price surged with bullish force and moved over $8000 resistance level. BTC is currently in a very positive zone and targeting the next resistance levels.
After Bitcoin broke above the $6800 and $7500 resistance levels, the bulls took full control and after correcting downwards to around $7000, bitcoin surged upwards massively breaking through $7200 and $7500 resistance levels quite easily. Also, BTC traded and settled well above the 100 hourly SMA. The bulls were also able to push the price above the $8000 resistance level and Bitcoin price even closed well above this level before correcting downwards.
The sellers around this level pushed the price downwards below $7800 support level. BTC tested the $7600 support level where the buyers appeared and stopped further losses. BTC is now back over the $7900 level moving towards $8000-8050 resistance level. However, there is a bearish pattern being formed with resistance around this level on the hourly chart which might push the price back downwards. If BTC is able to break above this range, there are chances that it might test the $8150 and $8300 resistance levels.

The chart shows that the bitcoin price is currently trading with bullish momentum. If BTC corrects downwards again, it is supported at $7950, $7500 and $6800 levels. On the upside, a break above $8050 resistance level might result in bitcoin testing $8300 and $8500 levels in the short term.


