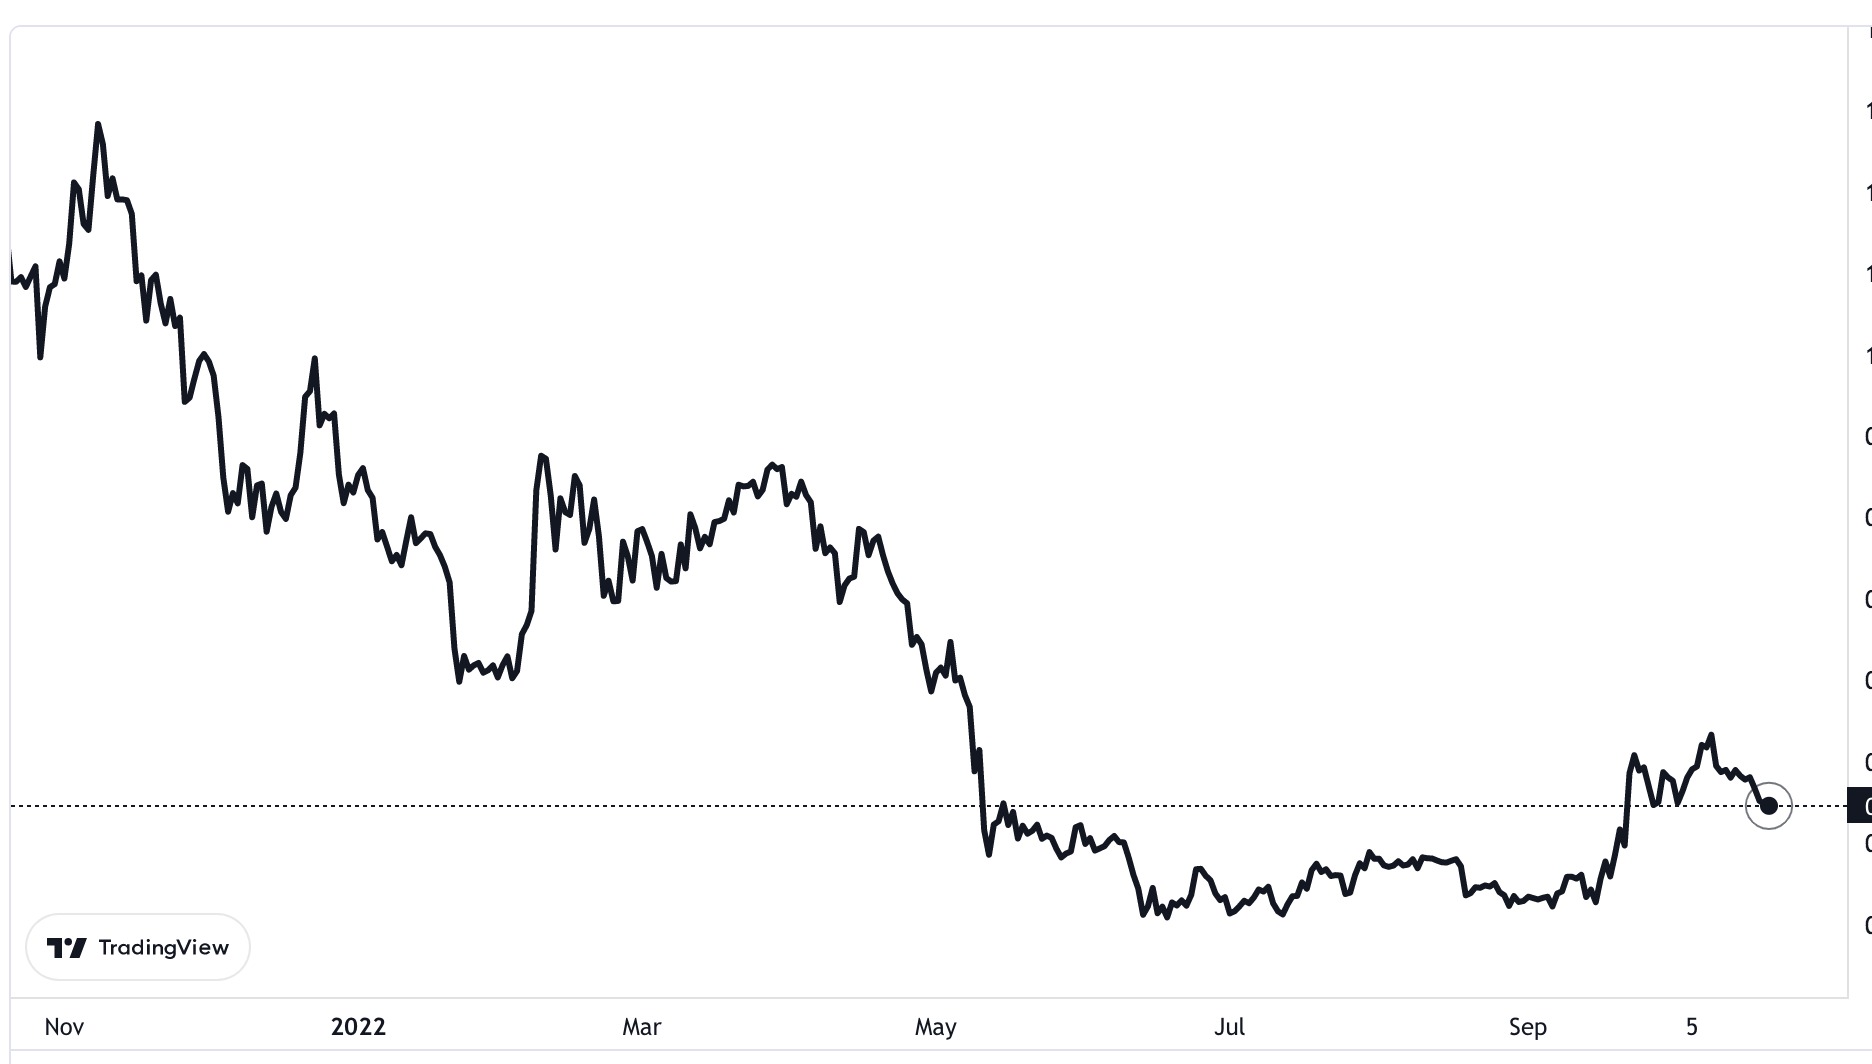
Every time the bulls attempted to go past the $0.48 price level, selling pressure was encountered by the XRP price.
The current Situation
Over the past 24 hours, XRP (1) has decreased by roughly 1%. The cryptocurrency lost more than 6% of its value over the previous week. If the currency moves past the level that serves as its immediate barrier, the bulls could return to the chart. The technical forecast for XRP indicated that the bears are in charge since XRP demand has decreased. The altcoin's market demand must increase if the bulls are to succeed. All technical indicators now portray cryptocurrency in a negative light.
What if the trend continues?
If buyers stay weak, a decline to $0.40 is only a question of the upcoming trading sessions. The coin price might drop to $0.38 after it breaks beyond the $0.40 barrier. Since last month, XRP has significantly recovered, but the coin has struggled due to fluctuating purchasing power. The price of XRP is now trading approximately 87% below its 2018 peak. At the time of writing, the alternative coin's price was $0.46. It attempted to cross the $0.48 price threshold, but the bears stopped it. As XRP demand continues to fall this month, the coin's rebound has not been able to persist.
At $0.48, there was resistance overhead. The bulls wouldn't seize control until XRP went over the $0.48 price level. The adverse pressure will lessen after the cryptocurrency crosses the $0.51 mark. On the other hand, less demand will allow the price of XRP to decline even further to its next support level of $0.44. If XRP drops below $0.44, it will reach $0.40 and then $0.38. The volume of XRP traded in the previous session decreased, showing weak purchasing power. The cryptocurrency is seeing weak purchasing power due to the recent rejection from the $0.48 level. The technical indications all point in the same direction.

The 200-SMA line is above the 20-SMA line (2), and the alternative coin even created a death cross. This is viewed as being highly pessimistic for the coin and suggests that the price of XRP may continue to decline. As sellers replaced buyers, the Relative Strength Index fell below the half-line. As demand for XRP began to wane and sellers began to dominate the market, the price fell below the 20-SMA line.
Future expectations
According to the other signs on its chart, the cryptocurrency signaled a sale. The Awesome Oscillator determines the velocity and direction of the price. Red histograms were still visible above the half-line on AO, serving as a sell signal for the price of XRP. Bollinger Bands gauge the degree of price volatility and the likelihood of change. There was less risk of future volatility because the bands were parallel. It also implied that XRP might swing sideways throughout the following several sessions before eventually heading north or south.


