Bitcoin just dropped around 6% since the news regarding the transfer of 50 BTC from a wallet of the 2009 era. Nobody knows whether it was the pseudonymous founder, Satoshi Nakamoto, who was cashing out.
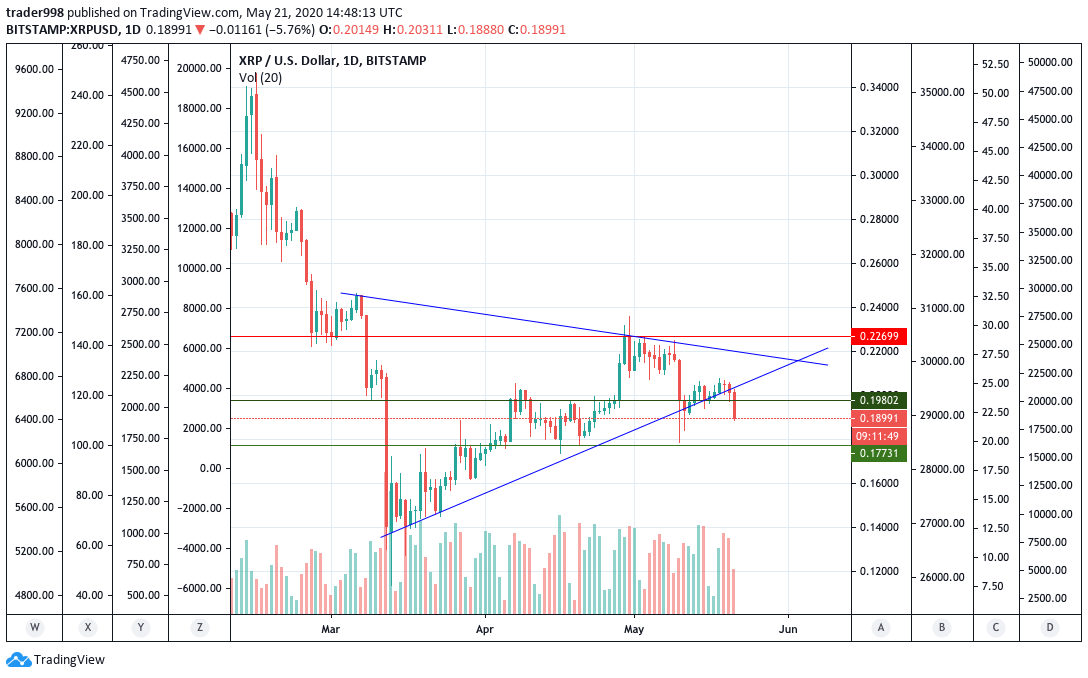
However, the fall rolled over to other Altcoins as well. Ripple, which was on the cusp of breaking out of a long converging triangle pattern, has finally done so.
XRPUSD declines more than 6%
Earlier in the week, we analyzed Ripple, and pointed XRP would fall below $0.198 f it breaks below this trendline.

The daily-timeframe for XRPUSD clearly shows the break-out candle. The large red candlestick came with a large volume, and hence the break-out was even more profound.
XRPUSD fell below the crucial support at $0.19802 and could fall to $0.177. The continuous selling pressure poses a significant cause of concern for the investors.
Check out XRPUSD Chart on TradingView.
Technical analysis of Tether and its short term outlook
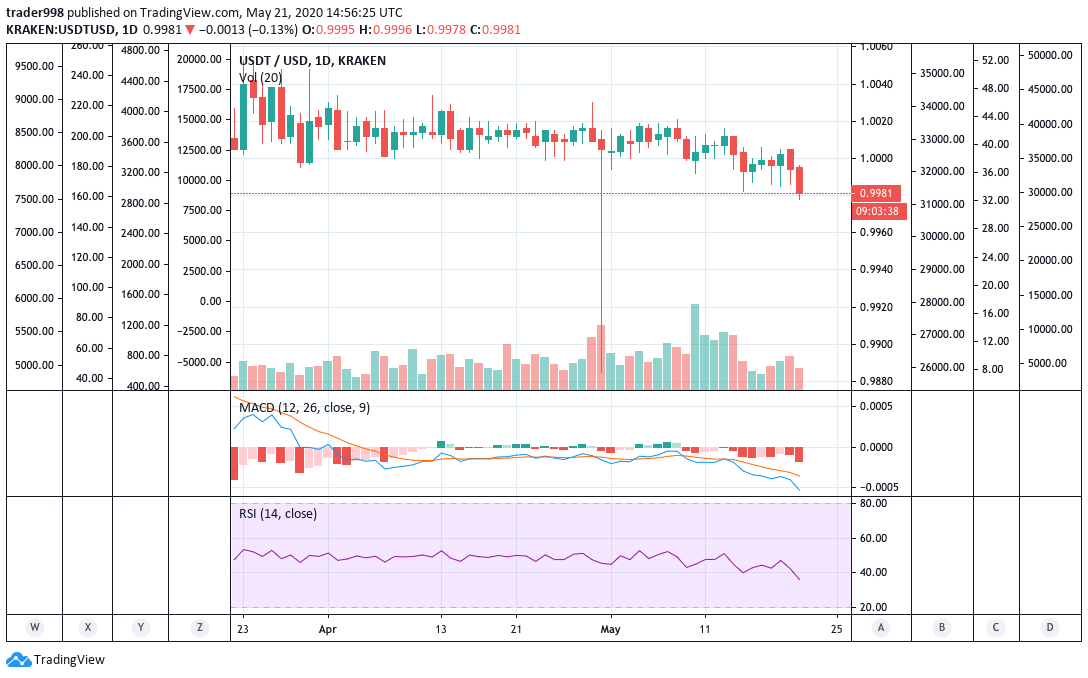
Tether or USDT has mostly been immune from the roller-coaster ride of most other Altcoins. It dropped only by a meager 0.09% in comparison to Bitcoin’s drop of 7%.

If we look at the technical charts of USDTUSD, we can see that the bearish signs are completely dominating. The daily timeframe shows the large red candles.
The MACD and RSI indicators are giving strong bearish signs. Both of them are giving a strong ‘sell’ indication.
Tether is pegged to the US dollar. It is unlikely to have a decline as massive as the other cryptos. However, the technical indicators are shouting out about an impending danger. The US economy is still coping with the Coronavirus pandemic shocks, as are most countries in the world.
One question remains unanswered: whether the pegged crypto has already factored in the shocks to the economy, or is it pointing to further problems? Perhaps only time would tell!


